第 9 章 Multiple plots
xfun::download_file("https://www.dropbox.com/s/7b3nbgfx5bgft8g/drake_annotationmaps.Rdata?dl=1")
load("drake_annotationmaps.Rdata")
drake_map <- drake
xfun::download_file("https://www.dropbox.com/s/v8rchkn63fzgjj3/drake_facet.Rdata?dl=1")
load("drake_facet.Rdata")
drake_facet <- drake
xfun::download_file("https://www.dropbox.com/s/apmooy1p0d54d7d/drake_grid.Rdata?dl=1")
load("drake_grid.Rdata")
drake_grid <- drake
9.1 Grid arrangement
- gridExra
install.packages("gridExtra")
library(gridExtra)9.1.1 grid.arrange
成品
drake_grid$loadTarget$ggGrid_electionMap()
ggGrid_electionMap %>% gridExtra::grid.arrange()
9.1.2 資料整理
將幾個比較小又擠在一起的行政區拆分出來。
drake_grid$loadTarget$dsf_newTaipeiDPP2()
drake_grid$loadTarget$gg_newTaipei2()
gg_newTaipei2
dsf_newTaipeiDPP %>%
filter(
!is.na(dpp)
) %>%
mutate(
shortname=stringr::str_remove(name, "區")
)-> dsf_newTaipeiDPP2dsf_newTaipeiDPP2 %>%
ggplot() + geom_sf() +
geom_sf_text(
aes(
label=shortname
), size=2
) -> gg_newTaipei
gg_newTaipeidsf_newTaipeiSplit <- list()
clusterNames <-
stringr::str_subset(
dsf_newTaipeiDPP2$shortname,
"[蘆重泰莊永]"
)
dsf_newTaipeiDPP2 %>%
filter(
!(shortname %in% clusterNames)
) -> dsf_newTaipeiSplit$notClustered
dsf_newTaipeiDPP2 %>%
filter(
shortname %in% clusterNames
) -> dsf_newTaipeiSplit$clustered
dsf_newTaipeiSplit9.1.3 行政區名地圖
dsf_newTaipeiDPP2 %>%
  ggplot() + geom_sf(
    color="white"
  ) +
  geom_sf_text(
    data=dsf_newTaipeiSplit$notClustered,
    aes(
      label=shortname
    ), size=2
  ) -> gg_newTaipei2
gg_newTaipei2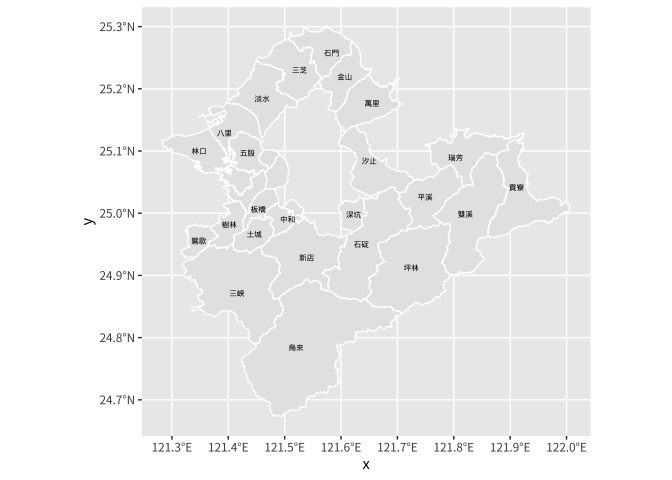
gg_newTaipei2 +
  geom_sf_text(
    data=dsf_newTaipeiSplit$clustered,
    aes(
      label=shortname
    ), size=1.5
  )+theme_void() -> gg_newTaipeiLabeled
gg_newTaipeiLabeled
9.1.4 得票率圖編修
ggsf_election+
  theme(
    legend.title = element_blank(),
    legend.key.width = unit(5,"points"),
    legend.key.height = unit(10,"points"),
    legend.position = c(0.85, 0.2)
  ) -> ggsf_electionRefined
ggsf_electionRefined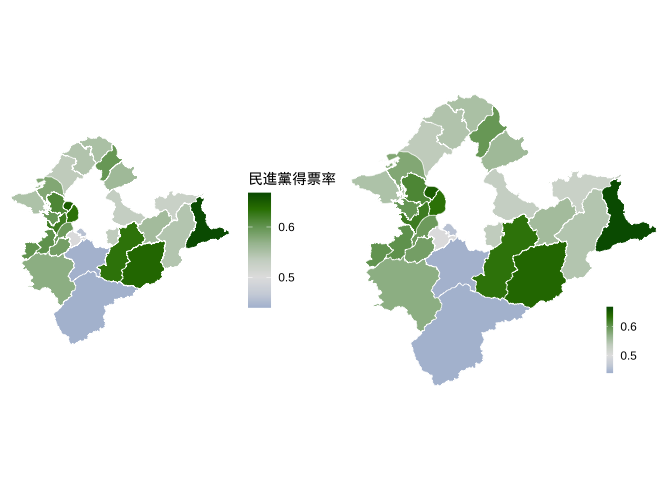
9.1.5 併圖
gridExtra::grid.arrange(
  ggsf_electionRefined,
  gg_newTaipeiLabeled,
  nrow=1,
  top="民進黨2020總統大選新北市得票率"
) -> ggGrid_electionMap
ggGrid_electionMap %>% gridExtra::grid.arrange()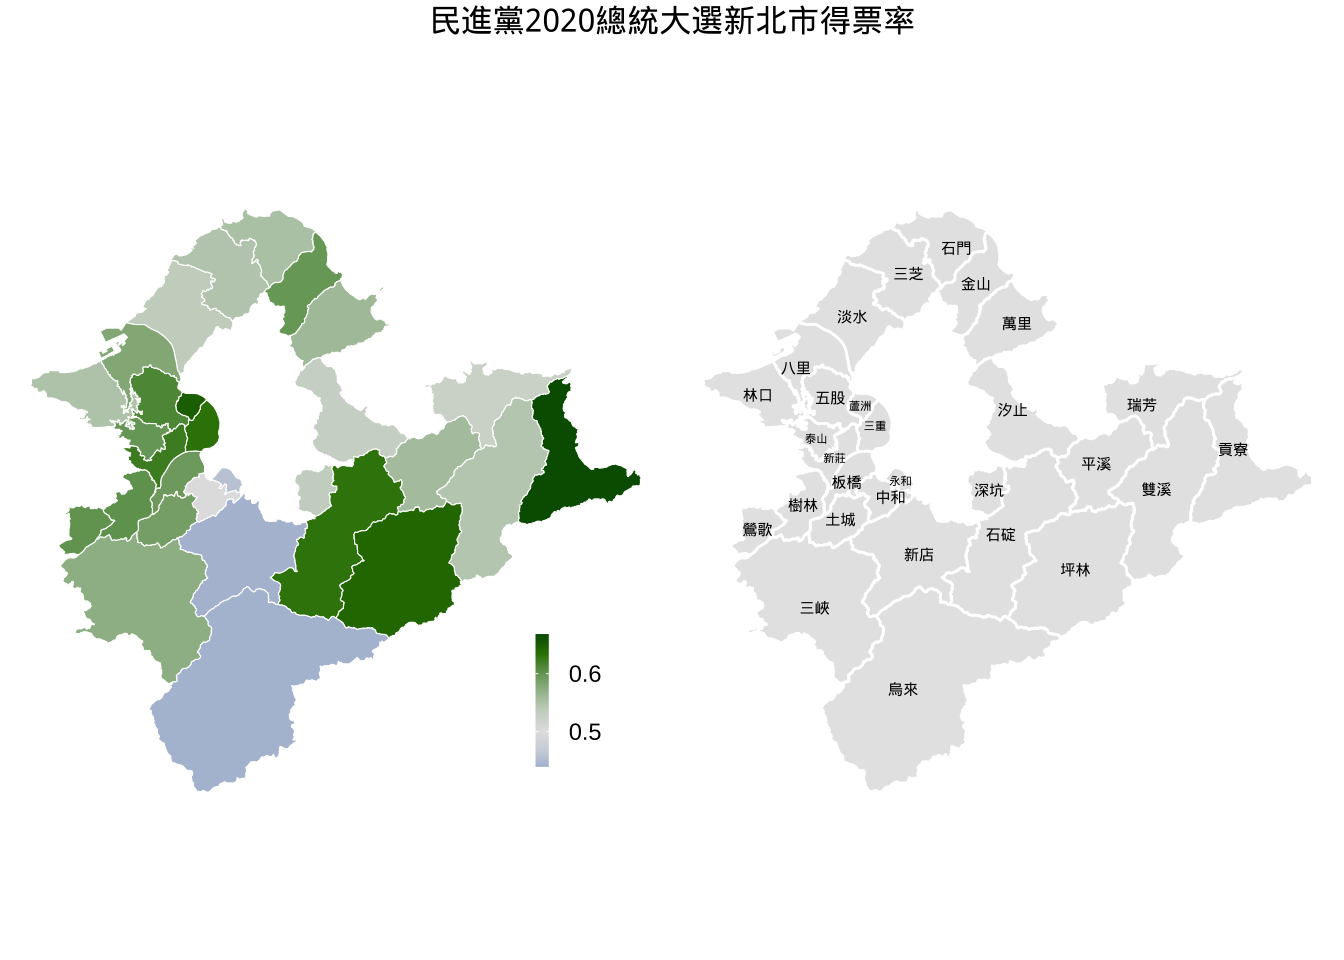
ggsave(ggGrid_electionMap, file="ggGrid.svg")9.2 Plot inset
