第 4 章 Graphing Basics
4.1 Drake Rmd📋
老師課堂練習repo:109-1-econDV/drake_plans/drake_graphing_basics.Rmd
先Active Rmd -> Drake Plan -> Make, Visualize active plan都沒問題即可進入本課題。
4.2 設定中文字體
Package: showtext
參考資料
showtext: https://github.com/yixuan/showtext
extrafont: https://github.com/wch/extrafont
R環境中文字形
# R在你電腦上找得到的字形
font_files() #  查詢有什麼字形
font_add("notoSansTC", # 把字形加到R系統裡,取名為notoSansTC family
         regular="NotoSansTC-Regular.otf", # family裡的regular字體檔名
         bold="NotoSansTC-Bold.otf") # family裡的bold字體檔名
font_families() # 查看notoSansTC family有沒有成功加入
# Google提供的字形
font_families_google() %>%
stringr::str_subset(regex("noto", ignore_case = T)) # 鎖定東方語系字形系列Noto
font_add_google("Noto Sans TC") # 加入無襯字的Noto繁體中文
font_families() # 查看notoSansTC family有沒有成功加入ggplot2中文字形
library(showtext)
showtext_auto()
theme(
  text=element_text(family = "Noto Sans TC")
  ) %>%
theme_set()你也可以在你的.Rprofile或drake makecondition裡加上:
font_add_google("Noto Sans TC") # 加入無襯字的Noto繁體中文

showtext_auto(enable=TRUE) #啟用字體
ggplot2::theme(
  text=ggplot2::element_text(family="Noto Sans TC")
) -> themeTextSetting
ggplot2::theme_set(
  themeTextSetting
)
R Markdown設定
如果你的圖是要在R Markdown裡直接knitr後呈現,不像我們這學期是要輸出後製的話,你要在setup chunk增加
knitr::opts_chunk$set(fig.showtext=TRUE, fig.retina = 1)4.3 Essential Elements
4.3.1 makecondition
假設你的font_families()已有“Noto Sans TC”
library(readr)
library(ggplot2)
library(drake)
library(rmd2drake)
library(dplyr)
library(showtext)
font_add(
  "Noto Sans TC",
  regular="NotoSansTC-Regular.otf",
  bold="NotoSansTC-Bold.otf")
# font_add_google("Noto Sans TC")
showtext_auto()
theme(
  text=element_text(family = "Noto Sans TC")
  ) %>%
  theme_set()

rprojroot::is_rstudio_project -> pj
pj$make_fix_file() -> root
4.3.2 ggplot()
# <<canvas>>
canvas <- ggplot()
generates a list of information holder
the object has a class of “ggplot” which equip with a print method that maps the list of information into a data visualization graph.
class(canvas)
canvas # deliver the result of its print methodstr(canvas,1)顯示一個完整的ggplot物件所需要的9個元素。
4.3.3 Layer-add operator: +
Add/fill detail information to canvas (i.e. the list-of-9-elements ggplot object) for a layer.
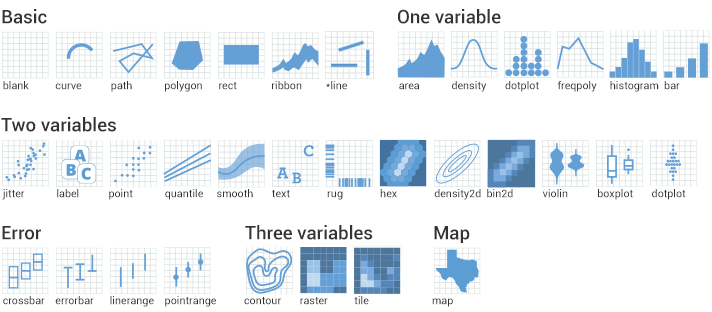
4.3.4 Geom layers
Generate information of geometric objects from data for adding to canvas
canvas+geom_line(...)
canvas+geom_density(...)
:
canvas+geom_tile(...)
4.3.5 Geom layers setup
mapping=aes(x=dataframe_variable1, y=dataframe_variable2, ...)data=a data frame
原始資料
# <<big5bankInterestRates>>
big5bankInterestRates = read_csv("https://www.cbc.gov.tw/public/data/OpenData/A13Rate.csv")
經過整理得到臺灣銀行不同期限定存之(年)利率(使用Drake addin: Loadd target at cursor可直接把subsetDataTWbank叫進global environment)
# <<subsetDataTWbank>>
資料data: subsetDataTWbank
座標對應coordinate:
x=西元年月,y=`定存利率-一個月-固定`
- 幾何圖示類型geom: line
Usage:
geom_line(
  mapping=aes(x=...,y=...)
  data=...
)- arguments定義順序是mapping, data. (沒有寫
mapping=,data=時要依定義順序放input arguments)
library(ggplot2)
# <<ggline>>
canvas +
  geom_line(
    mapping=aes(x=西元年月,y=`定存利率-一個月-固定`),
    data=subsetDataTWbank
  )

# 或
canvas +
  geom_line(
    aes(x=西元年月,y=`定存利率-一個月-固定`),
    subsetDataTWbank
)When data and mapping are required, geom function put mapping first and data second. So you can also write:
canvas +
  geom_line(
    mapping=aes(x=西元年月,y=`定存利率-一個月-固定`),
    data=subsetDataTWbank
  )
# or 省略input argument names **only if you following their definition orders**
canvas +
  geom_line(
    aes(x=西元年月,y=`定存利率-一個月-固定`),
    subsetDataTWbank
)幾何圖示類型為point
# <<ggpoint>>
canvas+
  geom_point(
    aes(x=西元年月,y=`定存利率-一個月-固定`),
    subsetDataTWbank
  )
4.3.6 Layer stacking
geom_...可以不斷以+層疊上去。
# <<ggLinePoint>>
ggline +
  geom_point(
    aes(x=西元年月,y=`定存利率-一個月-固定`),
    subsetDataTWbank
  )
不同期限利率一層層疊上去
# <<ggline3M>>
ggline3M
# <<ggline1Y>>
ggline1Y
# <<ggline2Y3Y>>
ggline2Y3Y
查看最後的ggplot物件
ggline2Y3Y:Layers元素每個都有重覆的subsetDataTWbank
可以把subsetDataTWbank移到一開始的
ggplot()裡,則後面的geom都可以不寫data
# <<canvas2>>
canvas2 = ggplot(data=subsetDataTWbank)
# <<ggline2Y3Y_2>>
ggline2Y3Y_2 = {
canvas2 +
geom_line(
aes(x = 西元年月, y = `定存利率-一個月-固定`)
) +
geom_line(
aes(x = 西元年月, y = `定存利率-三個月-固定`),
color = "blue"
) +
geom_line(
aes(x = 西元年月, y = `定存利率-一年期-固定`),
color = "green"
) +
geom_line(
aes(x = 西元年月, y = `定存利率-二年期-固定`),
color = "brown"
) +
geom_line(
aes(x = 西元年月, y = `定存利率-三年期-固定`),
color = "red"
)
}4.3.7 Labels and theme
加上labels和classic theme
# <<ggTwbInterestRates>>
ggTwbInterestRates= {
  ggline2Y3Y +
    labs(
      title="臺灣銀行不同期限定存利率",
      subtitle="固定利率,單位:% 年率",
      caption="資料出處: 政府開放資料平台https://data.gov.tw/dataset/10359",
      y="",
      x=""
    )+theme_classic()
}
換掉theme
ggTwbInterestRates_bw= {
  ggTwbInterestRates +
    theme_bw()
}4.4 圖形存檔
saveGgline = {
  ggsave(
    ggTwbInterestRates,
    file=file.path(
      root(),"img/ggTwbInterestRates.svg"
      ), width=8, height=5)
}
4.5 後製
openSVG
svgOpen(
  file.path(
    root(), "img/ggTwbInterestRates.svg"
  )
)
4.6 文章寫作
範例文件:https://www.dropbox.com/s/kctvb7ltggkg6ca/myResearchPaper.zip?dl=0
drake_myResearchPaper.Rmd: 定義drake plan的Rmd, 它可以生成plan_drake_myResearchPaper.R
plan_drake_myResearchPaper.R:
source()後會生成以四個物件:- plan_drake_myResearchPaper
- mk_plan_drake_myResearchPaper
- vis_plan_drake_myResearchPaper
- load_drake_myResearchPaper: 用來提取drake cache中已存在的target放到global environment
myResearchPaper.Rmd: 正式的文章寫作Rmd. drake_myResearchPaper.Rmd中的makecondition可能也需要放到裡面。
步驟1
針對drake_xxx.Rmd檔

步驟2
針對myResearchPaper.Rmd設定setup chunk
```{r setup, include=FALSE}
## 你的makecondition

## 產生可讀取drake_cache的loaddd函數
source("plan_drake_xxx.R")
loaddd <- load_plan_drake_xxx
```
需要target時,使用
```{r}
loaddd(targetK)
targetK
```按knitr產生文章成品。
步驟3(optional)
在drake_xxx.Rmd 增加以下target
```{r report}
report = rmarkdown::render(
    knitr_in(".../myResearchPaper.Rmd"),
    output_file = file_out(".../myResearchPaper.html"),
    quiet = TRUE
  )
```target={command}當command只有一行指令時,可以不寫{}